
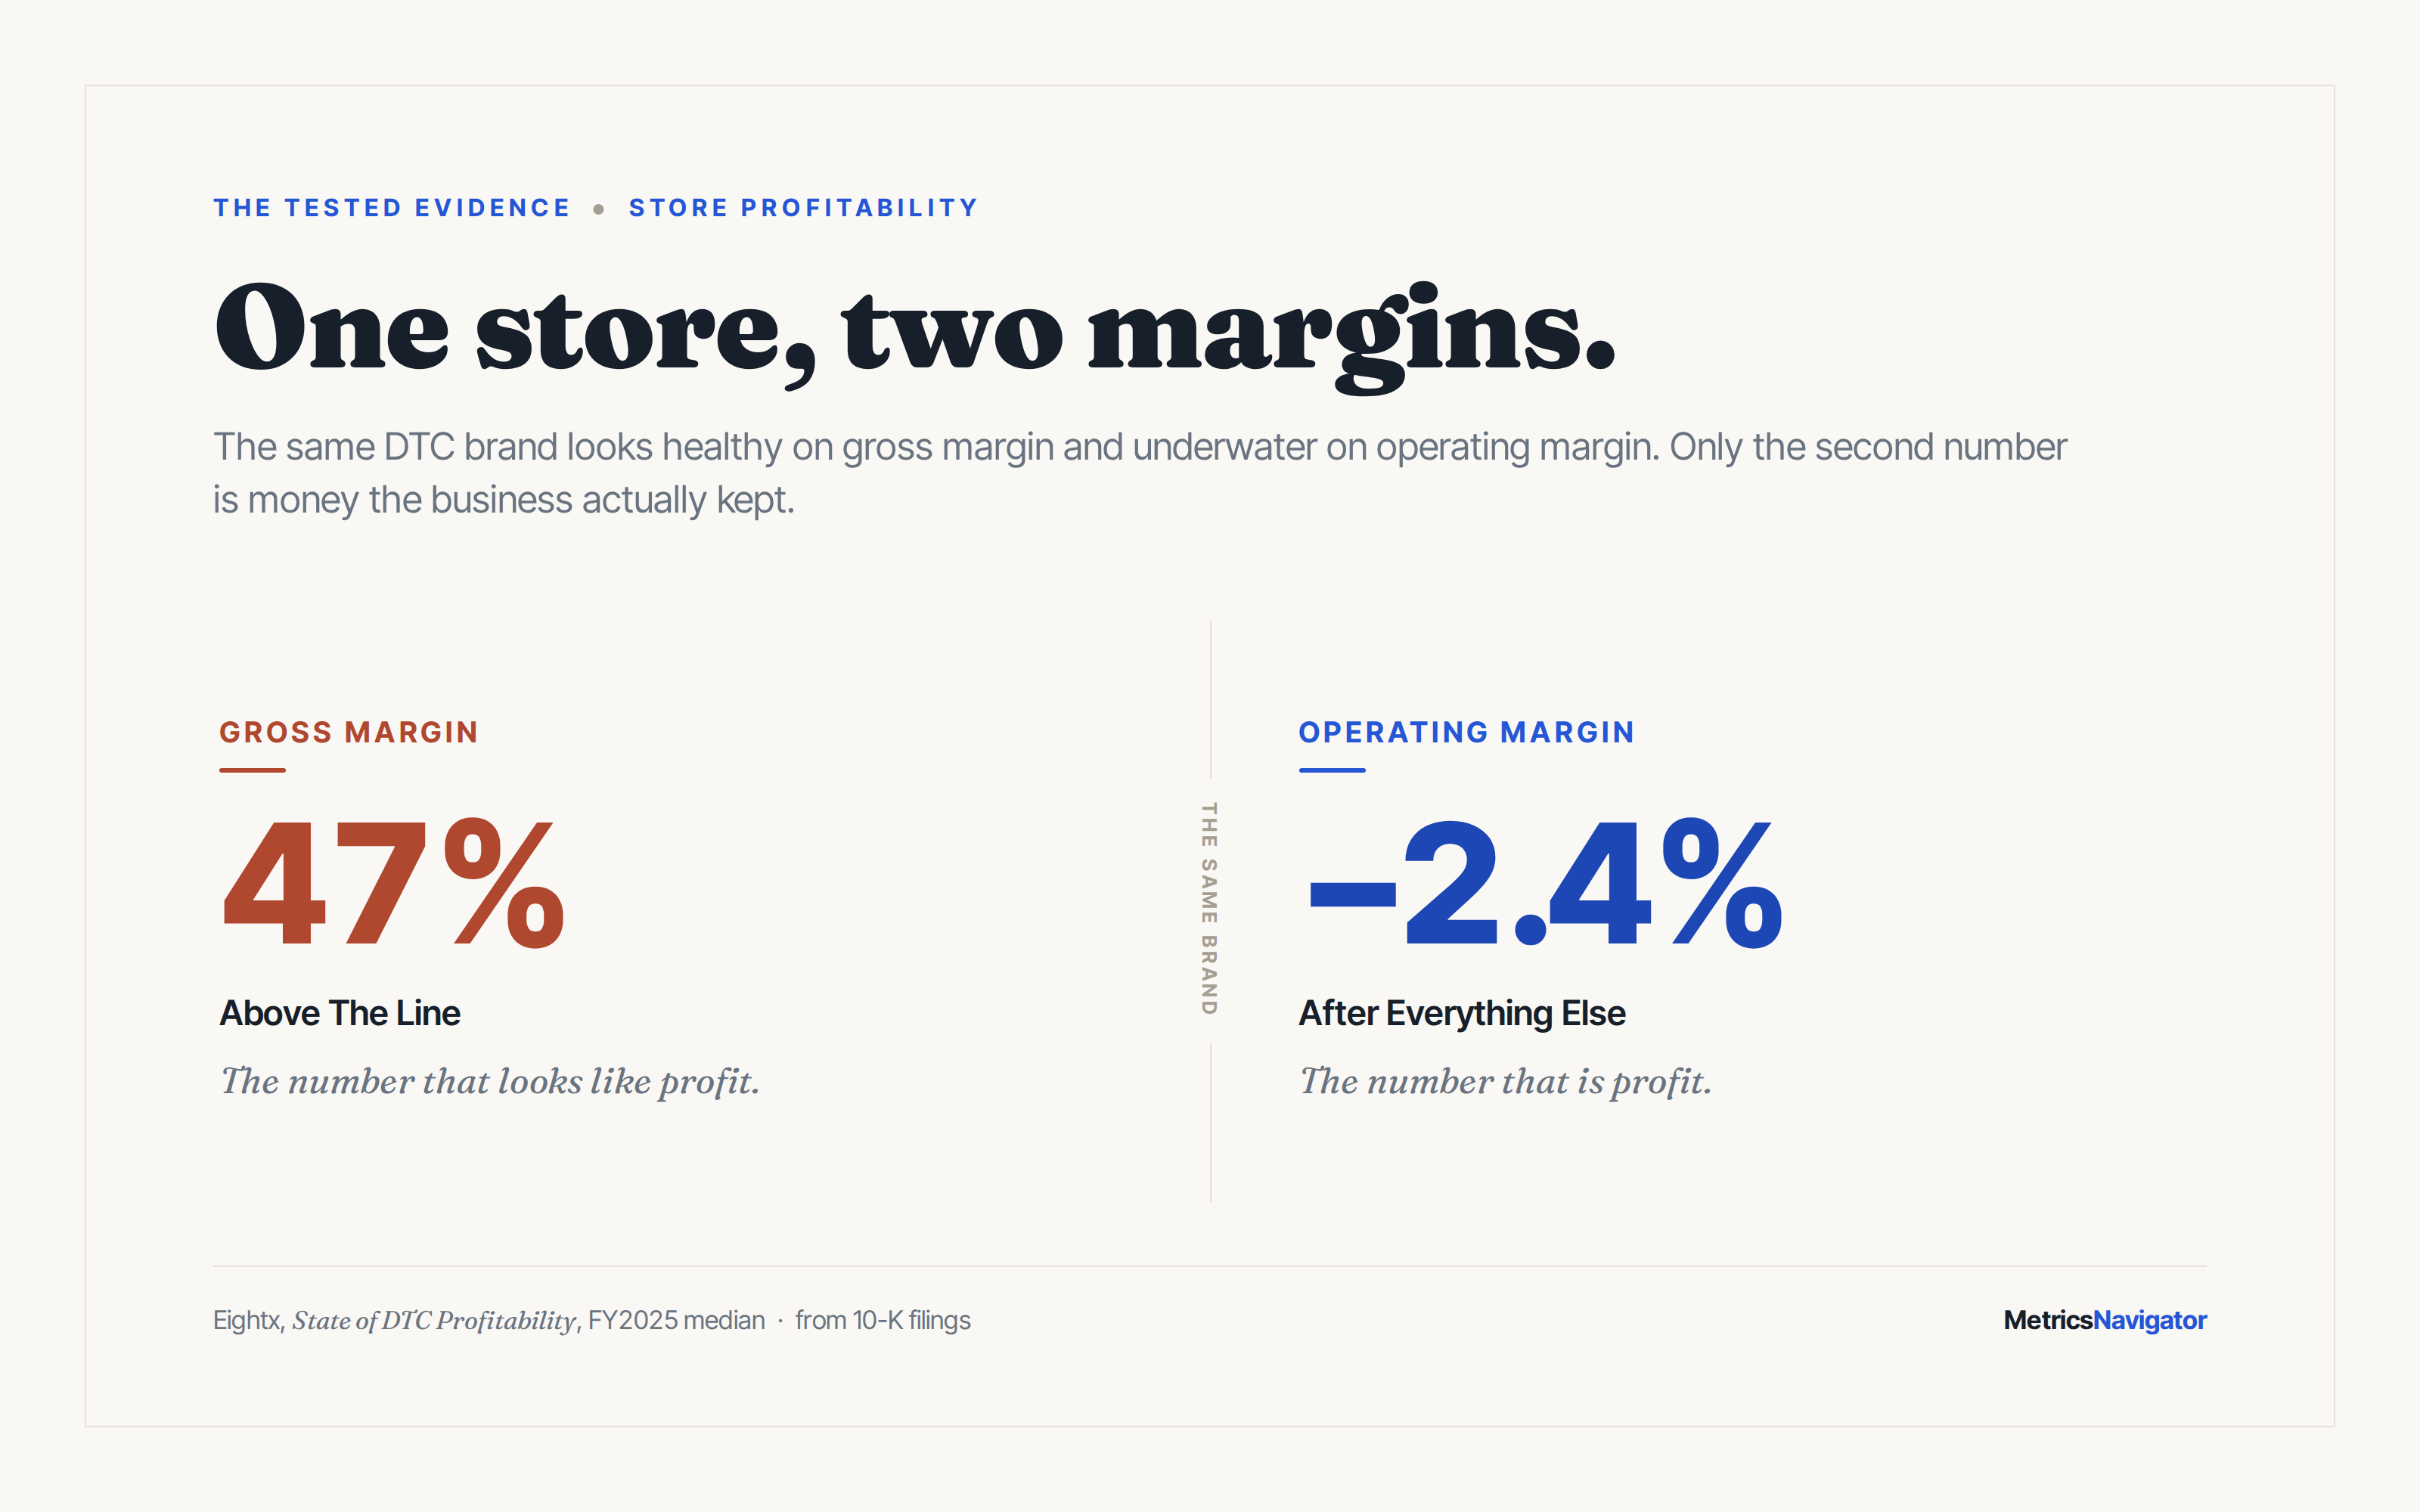
A store can hold a 47% gross margin and still finish the year underwater. The median public DTC brand did exactly that in FY2025: a -2.4% operating margin against a median gross margin near 47%, measured on the same cohort of SEC filers (Eightx, State of DTC Profitability, from 10-K disclosures). The loss had nothing to do with what the products cost. It came from everything below the gross-margin line: fulfillment, returns, discounting, ad spend, and overhead.
This is the evidence file for store profitability. It covers how to read profit per order and per product on your own store, where the margin leaks once a sale ships, and which of the popular rules failed verification. Every claim below names its source.
The short version: gross margin tells you almost nothing about whether a store makes money. The median public DTC brand ran a -2.4% operating margin in FY2025 on a roughly 47% gross margin (Eightx). Profit is decided below that line, in fulfillment, returns, discounting, and ad spend, and the one number that captures it is contribution margin per order. Measure that, and measure which customers and products carry it, before you scale spend.
Because gross margin only accounts for the cost of the goods, and the goods are rarely where the money dies. The median public DTC brand's -2.4% FY2025 operating margin sat under a median gross margin near 47%, in the same cohort (Eightx, from 10-K filings). The roughly 49 points between those two numbers is SG&A, marketing, and fulfillment: real cash that leaves the business on every order after the product is paid for.
A separate 10-brand public panel makes the same point over time. Its median operating margin round-tripped from 14.6% in FY2020 to 2.9% in FY2022 and back to 5.3% in FY2025, while its gross margin barely moved, 55.9% to 57.0% (Eightx).
Gross margin sat nearly still while operating profit swung more than eleven points. If gross margin were a profit signal, that swing would have shown up in it. It didn't.
Contribution margin is the money a sale leaves behind after every cost that varies with that sale: product, shipping and fulfillment, payment processing, the returns it triggers, and the variable marketing it took to win. It is the number gross margin pretends doesn't exist, and it is the one that decides whether volume helps you or bleeds you.
You strip an order down to what it truly leaves behind. Start with revenue and subtract, in order, the costs that only exist because the order happened. Gross margin stops after the first subtraction. Contribution margin keeps going until the order has shipped, been paid for, and survived the return window.
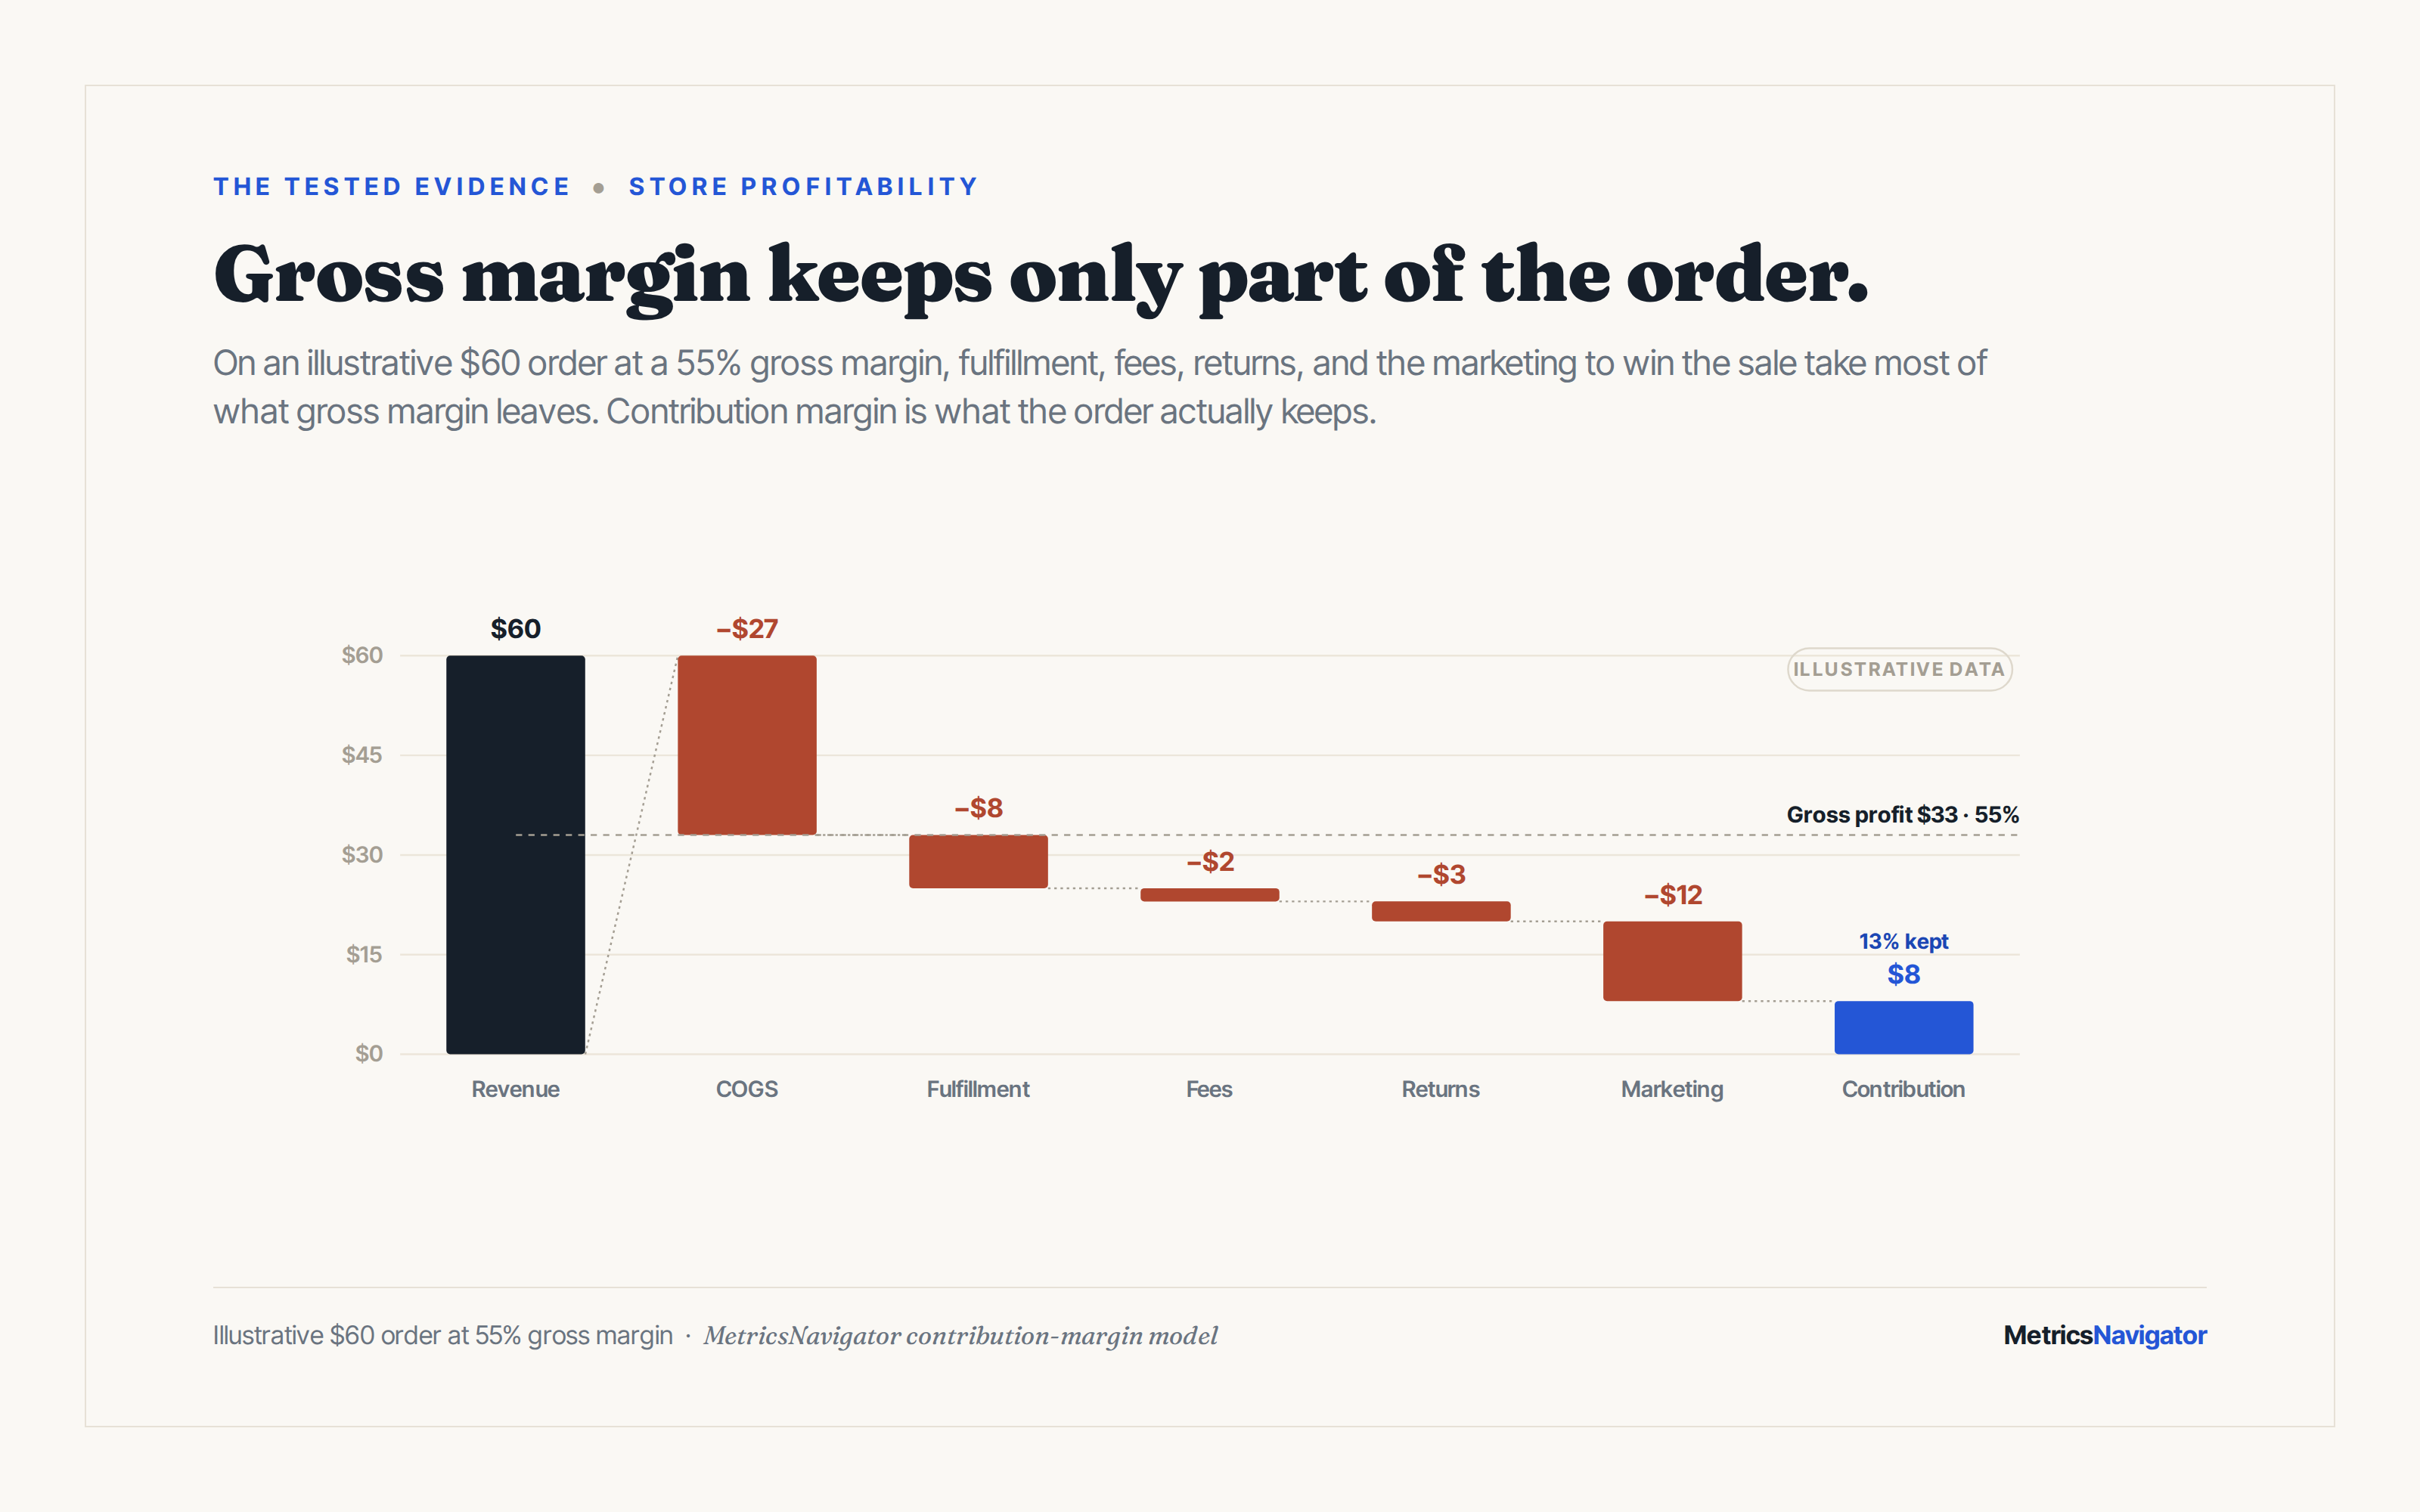
Take an illustrative order at a $60 average order value. A 55% gross margin leaves $33 of gross profit.
Shipping and fulfillment take about $8. Payment processing takes roughly $2. A returns reserve, priced off the order's category return rate, takes another $2 to $3. And the variable marketing it took to acquire that order, at an illustrative $12, comes off the top.
The $33 of gross profit is closer to $8 by the time the order clears. The gross margin read 55%. The contribution margin on that order is about 13% (figures illustrative).
The subtractions are not small, and they grow with scale rather than shrinking. Amazon's fulfillment and shipping costs climbed from roughly 18% of net sales in 2011 to about 31 to 32% by 2021, compiled from its 10-Ks: cost creep is structural even at maximum logistics scale.
Public DTC apparel brands run shipping in the region of 12 to 18% of revenue (Eightx, synthesizing FY2025 10-K disclosures, producer-price data, and operator figures). And 39% of shoppers who abandon at checkout cite extra costs like shipping and fees (Baymard, survey of US online shoppers' reasons for abandonment), so the fulfillment line taxes conversion on the way in and margin on the way out.
Returns behave like a fixed cost of doing business online, but they are measurable, concentrated, and partly controllable. In 2025, an estimated 19.3% of online sales were returned, part of a projected $849.9 billion in total US returns, with about 9% of returns judged fraudulent (NRF, 2025 projection). Online apparel runs higher, at a 24.4% return rate, about five points above that 19.3% overall online rate (Coresight, via SAP).
The cost is not just the refund. On Eightx's 2026 modeled benchmark, processing a returned apparel item runs roughly $25 to $35 all-in, covering inbound freight, inspection, repackaging, and either restocking or write-off (Eightx, built from Optoro, Pitney Bowes, and Coresight figures). It is a modeled range rather than one surveyed number, so treat it as an order of magnitude, not a precise unit cost.
Take an apparel store at a $100 average order value and the category's 24.4% return rate. On 1,000 orders, 244 come back. At roughly $30 to handle each returned item, that is about $7,300 in processing cost alone, before you count the margin you never earned and the units you cannot resell at full price.
In a Coresight survey, 67% of apparel brands and retailers said cutting returns to zero could lift their online bottom line by at least 20% (Coresight, survey of retailer opinion).
That is why 70.2% of Shopify merchants now charge return fees, up from 65% a year earlier, across an analysis of 13 million returns (Loop, vendor data). The lever most stores miss is upstream: returns concentrate in specific SKUs, usually sizing-dependent ones, and tracking the return rate per product tells you which items to reprice or drop before they scale.
Price is the highest-leverage line on the P&L, and most stores never test it. On the average S&P 1500 income statement, a 1% improvement in price lifts operating profit by about 8%, because the extra dollar carries almost no additional cost (McKinsey, The Power of Pricing).
The same math runs in reverse: a 5% price cut needs an 18.7% increase in volume just to break even (McKinsey, same analysis). Discounting to “move units” usually moves them at a loss the volume never repays.
Discounting also compounds against you over time. The average US holiday discount hit 23% in late 2024, across 1.5 billion shoppers on Salesforce platforms.
Allbirds shows where that road ends: its gross margin fell from 52.9% in 2021 to 41.0% in 2025 and never recovered, as sustained markdowns trained customers to wait for the next sale (Eightx teardown of the SEC filings), part of a slide from a roughly $4 billion peak valuation to a $39 million asset sale.
There are cleaner ways to lift order value than cutting price. Raising a free-shipping threshold from $100 to $500 produced a 12% gain in revenue per visitor, a 6% higher average order value, and conversion up 5.5%, for a brand whose old threshold already gave free shipping on more than 85% of orders (Intelligems, single vendor case study).
And in a dataset of 182 million discount codes across 1,348 Shopify brands, minimum-spend thresholds were associated with a 2.6x higher average order value on amount-off codes (Seguno, vendor data). The point is to test price against profit per visitor, not to reach for a blanket percentage off.
Fewer than the size of the catalog suggests, but the measured version of that claim is narrower than the 80/20 rule everyone quotes.
The rigorous concentration data is measured on customers, not SKUs: across 238 brands and 22 CPG categories tracked over six years, the top 20% of buyers accounted for about 73% of sales on average, with the ratio running anywhere from 0.64 to 0.89 by category (Kim, Singh & Winer, Marketing Letters, 2017).
Follow-up academic work frames the working rule as roughly 70/20, not the tidy 80/20 everyone quotes (McCarthy & Winer, Marketing Letters, 2019).
No comparable public dataset establishes a universal SKU split, so the popular “80% of your revenue comes from 20% of your products” is an assumption, not a finding. The move is to compute it on your own catalog, ranked by contribution margin rather than revenue, because a high-revenue SKU with a 30% return rate and heavy shipping can sit below a quieter product that keeps most of what it sells.
Whether two products sell better together is the same kind of question: answerable from your own basket data, not from a borrowed benchmark.
Read this way, product profitability stops being a gross-margin sort and becomes a contribution sort. The tail that looks like harmless variety is often where the losses hide, and the concentration at the top tells you which products deserve the ad budget.
They measure controllable inputs on a fixed cadence, not just a revenue dashboard when it looks bad. Amazon's Weekly Business Review is a fixed 60-minute meeting reviewing 400 to 500 metrics, organized so that controllable input metrics (the things you do) come ahead of output metrics like revenue and cash flow, and run by exception (Commoncog, documenting Working Backwards).
The premise is that outputs are lagging; you steer with inputs.
Smaller operators run the same discipline at their own scale. Ridge, a nine-figure Shopify brand, publicly ran its Q4 2021 on daily profit tracking, with founder Sean Frank describing “six figures in revenue, five figures in profit every day” and a goal of being profitable day by day while maximizing cash on hand (DTC Podcast, operator-reported, not audited).
The number he watched was profit, not revenue, and he watched it daily.
The reason this matters is that real profitability is slow and unforgiving. Warby Parker reached its first full year of GAAP net income in FY2025, about $1.6 million on $871.9 million of revenue, a 0.2% net margin roughly 15 years after founding (Warby Parker, FY2025 results).
For grounding, the average Shopify store converts around 1.4% of its traffic (Littledata, 2,800 stores, the firm's own term is “average”). At that conversion and those margins, guessing is expensive. A weekly cadence on contribution margin, returns, and concentration is what separates operators who catch a leak in a week from those who find it in the annual accounts.
The claims cut from this file, and why:
“The median public DTC brand runs a -2.4% operating margin on ~57% gross margins.” Panel-mixing. The -2.4% cohort's median gross margin is near 47%; the 56 to 57% figures come from separate Eightx panels, one of which shows a +5.3% median operating margin. Each panel has to be quoted whole, so this post pairs -2.4% only with 47% (Eightx, State of DTC Profitability).
“80% of your revenue comes from 20% of your SKUs.” No strong public SKU-level dataset supports that split. The rigorous concentration data is customer-level and averages roughly 70 to 73 per 20, varying 64 to 89 by category (Kim, Singh & Winer, 2017). Measure your own catalog rather than assuming the law.
“X% of DTC orders are unprofitable after variable costs.” No published cross-merchant order-level profitability distribution exists. The closest defensible proxies are that 44% of pure-play e-retailers report being unprofitable (Ipsos, via Retail Dive) and that Casper's S-1 showed roughly 20% of gross revenue lost to refunds and discounts. Inventing an order-level percentage is not supported.
“It costs $66 to process a $100 return.” A stretched version of an older, apparel-specific claim that processing can eat a large share of an item's price, repeated as if it were a flat rule. No clean primary source publishes a per-$100 processing cost. The defensible figure is per returned item, roughly $25 to $35 all-in for apparel, from Eightx's 2026 modeled benchmark built on Optoro, Pitney Bowes, and Coresight data. This post uses that instead.
“90% of ecommerce startups fail within 120 days.” An unverifiable 2019 UK PR survey with no published methodology, contradicted by government data showing roughly 80% of US businesses survive year one (BLS). This post uses the BLS survival figures instead.
“The average Shopify store makes $X per month.” Every circulating figure derives from opaque store-scraping with survivorship and selection bias. There is no citable primary dataset, so no revenue-per-store benchmark appears here.
ASK THE AI. Paste into ChatGPT or Claude, with numbers you already know:
· “My average order value is [X] and my blended gross margin is about [Y]%. Walk me through a contribution-margin-per-order calculation that subtracts shipping and fulfillment, payment fees, a returns reserve, and the variable marketing it takes to get the order, and tell me what's left.”
· “Here are my top products with unit price, unit cost, units sold, and return rate: [paste]. Rank them by total contribution margin, not revenue, and show me which products earn the profit and which ones lose money after returns.”
· “My return rate is [X]% and processing a return costs me about [Y] per order. Show me the annual profit I would recover at a two-point lower return rate, and where sizing-driven apparel returns usually concentrate.”
On contribution margin. Gross margin stops after product cost and ignores fulfillment, returns, payment fees, and the variable marketing that earned the sale, which is where DTC profit dies: the median public DTC brand ran a -2.4% operating margin on a roughly 47% gross margin (Eightx). Rank products by contribution, not revenue or gross margin.
There is no universal red line, but online returns averaged an estimated 19.3% of online sales in 2025 and apparel ran 24.4% (NRF projection; Coresight), and processing each returned apparel item runs roughly $25 to $35 all-in (Eightx, 2026 modeled benchmark). Track return rate per SKU rather than as a store average, because a few products usually drive most of the drag.
Concentration is real but measured at the customer level: the top 20% of buyers average about 73% of sales across 238 brands (Kim, Singh & Winer, 2017). No public dataset proves a universal SKU split, so rank your own catalog by contribution margin instead of assuming 80/20. The losses often hide in the long tail that looks like harmless variety.
MetricsNavigator builds per-order and per-product contribution margin, returns drag, and customer and product concentration from your store's real order history when you connect your store. The profit picture your gross margin hides, without the spreadsheet.


