
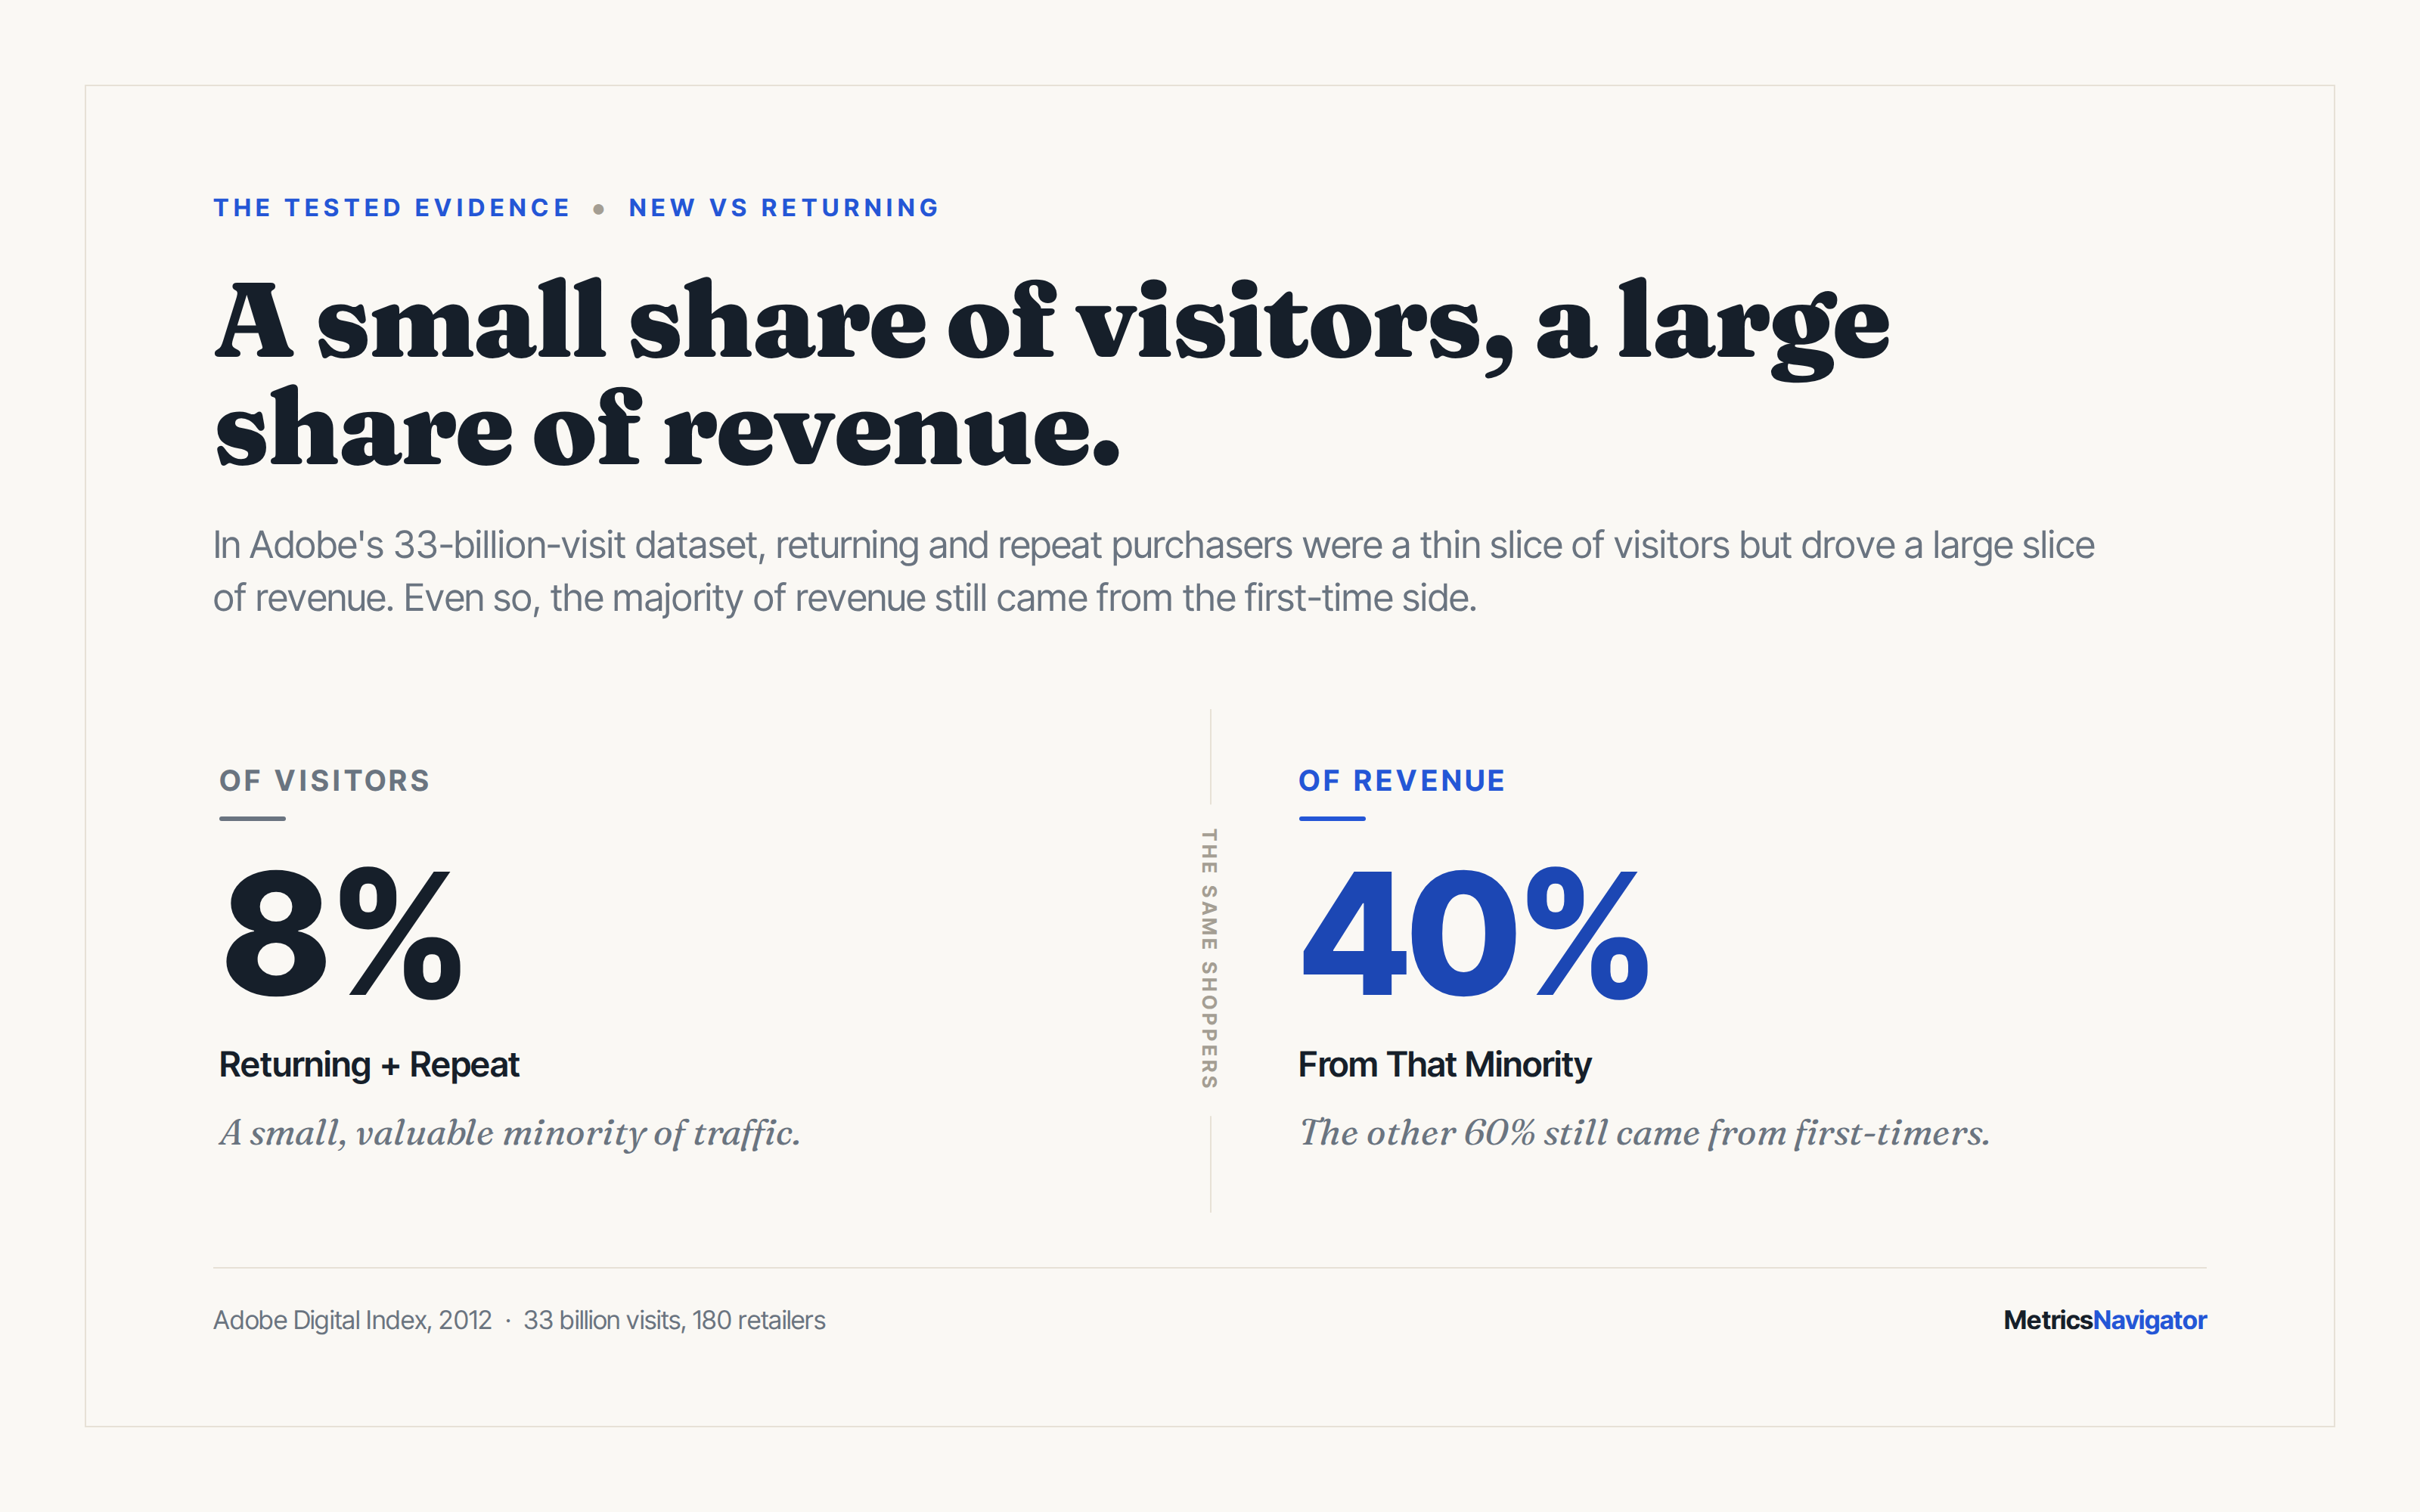
The most-quoted number about returning customers comes from a 2012 Adobe dataset of 33 billion visits: returning and repeat purchasers were 8% of site visitors and drove 40% of US revenue. It travels as proof that repeat customers are where the money is. Read the same figure the other way and it says the other 60% of revenue came from the first-time side.
Both readings are true, which is the whole problem with the new-versus-returning split. It is a ratio, and a ratio can climb because loyalty improved or because acquisition stalled. This is the evidence file for the revenue mix: what the measured data actually shows returning customers contribute, why a rising returning share is an ambiguous signal, and how to read the split on your own store without the folklore. Every claim below names its source.
The short version: the new-versus-returning revenue split is a ratio, not a scoreboard. A returning visit converts far better than a first-time one, but a rising returning share can mean loyalty grew or that new-customer acquisition slowed, and it drifts upward on its own as a store ages. Growing brands grow about twice as much from acquisition as from cutting defection. Read new and returning revenue as two absolute trends on fixed cohorts, not one blended ratio.
There is no universal number, and the famous benchmark is older and narrower than it sounds. In Adobe's dataset of 33 billion visits across 180 retailers (April 2011 to June 2012), returning and repeat purchasers were 8% of US site visitors and generated 40% of revenue (Adobe Digital Index, 2012). That figure describes visitor segments, not a customer-based revenue split, and it is well over a decade old.
The 92% of visitors Adobe calls “shoppers” includes everyone who never bought anything, so the group's low revenue is partly a conversion story, not a spending one. Per visit, a returning purchaser was worth $5.22 and a repeat purchaser $10.24, against $2.06 for a first-time shopper (Adobe Digital Index, 2012). The per-visit asymmetry is real and large. The headline that gets repeated, “returning customers are 40% of revenue,” is the part that travels badly, because it is a decade-old visitor mix, not a current customer-based split, and in that very dataset the majority of revenue still came from the non-returning side.
Category and store age set the split, and they pull it in opposite directions. A monthly consumable brand and a mattress store have different answers by design, and a two-year-old store and a two-month-old store do too. In absolute customer terms the returning group is usually small: across 156,110 DTC customers the 365-day repeat purchase rate was 18.8% (BS&Co dataset). Value concentrates in that minority, which is why one blended figure misleads. Across 339 non-CPG public companies the top 20% of customers delivered about 67% of sales (McCarthy & Winer, Marketing Letters, 2019), the concentration covered in the customer lifetime value evidence file. A small, loyal minority drives an outsized share. The exact share is yours to measure, not to borrow.
It can be either, because the share is a ratio. Returning share equals returning revenue divided by total revenue, so it rises when returning revenue grows and it rises just as cleanly when new-customer revenue falls. The second case looks identical on the ratio and means the opposite for the business.
Take two illustrative stores. Store A holds new-customer revenue flat at $100k and grows returning revenue from $40k to $60k, so its returning share climbs from 29% to 38% on real growth. Store B holds returning revenue flat at $40k while new-customer revenue falls from $100k to $60k, and its returning share climbs from 29% to 40% on an acquisition problem. Same rising share, opposite health. (Figures illustrative.) The ratio alone cannot tell you which store you are running.
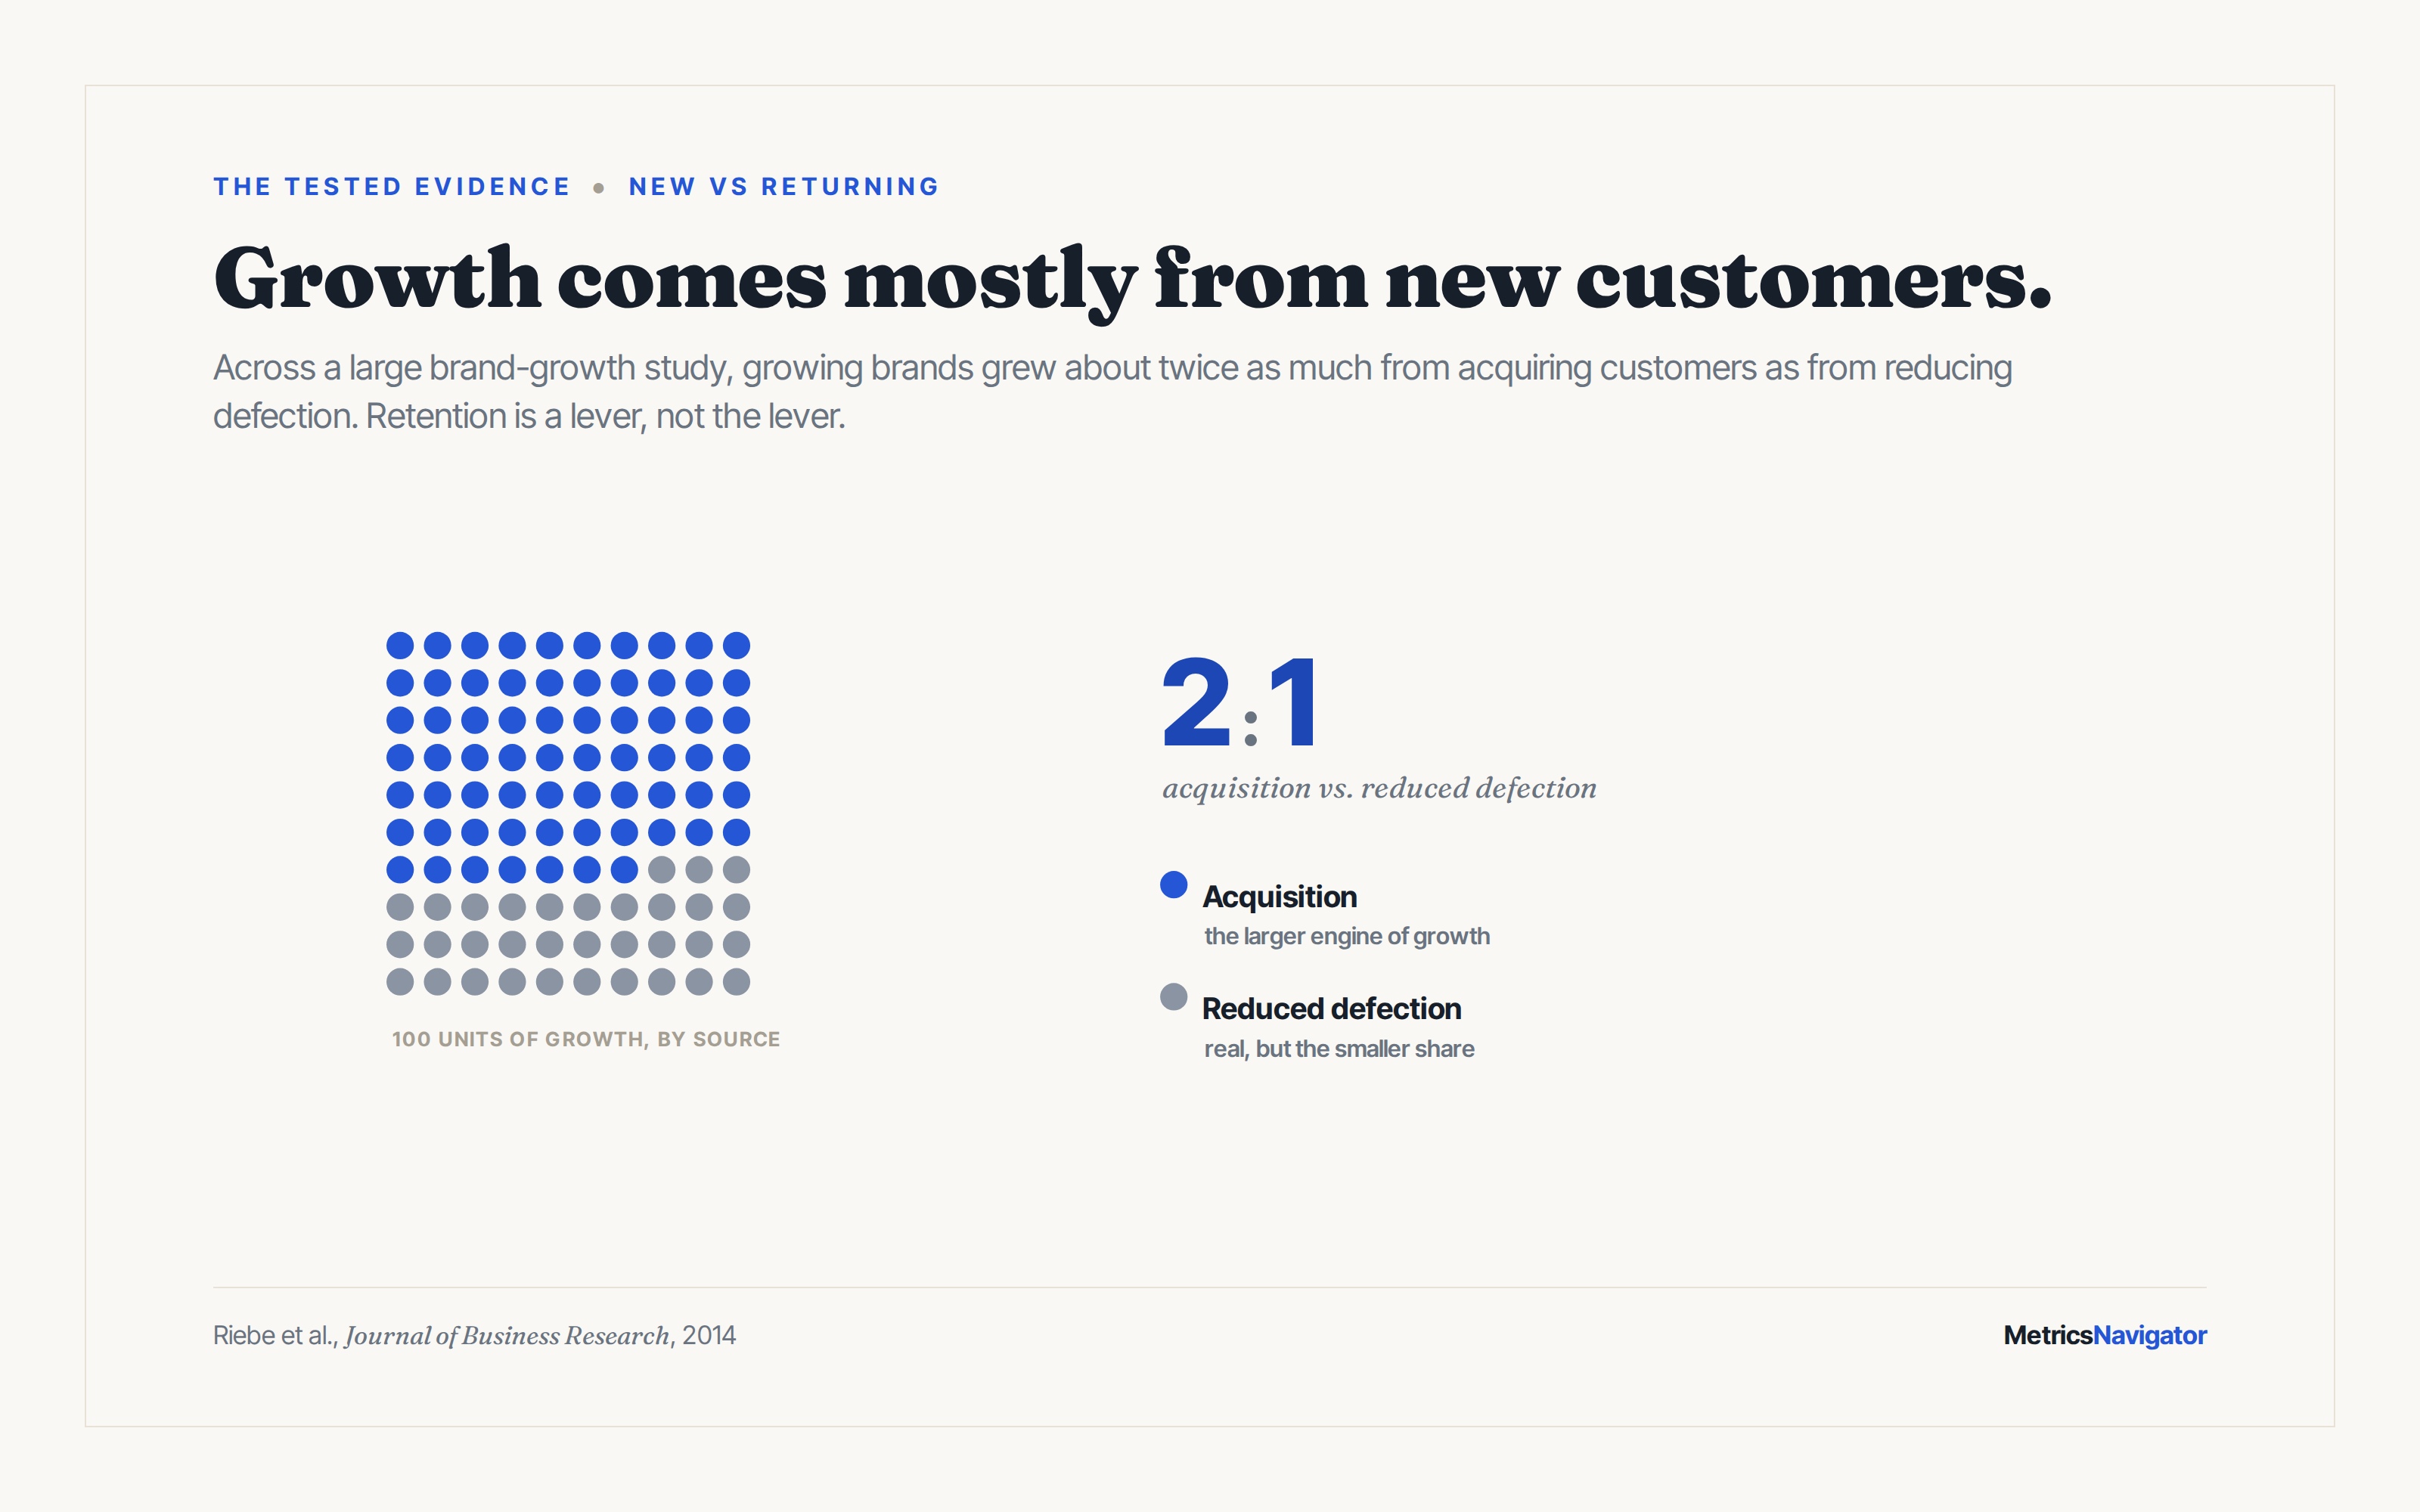
This matters because acquisition is the larger growth engine for most brands that are actually growing. Across a large brand-growth study, growing brands grew about twice as much from acquiring customers as from reducing defection (Riebe et al., Journal of Business Research, 2014). Treating “returning share up” as the goal can quietly starve the side of the business that moves the top line. Retention is a lever, not the lever, a point the retention evidence file makes in full.
Two mechanical forces push the returning share upward over time whether or not anything improved, and both are easy to mistake for progress. One is a base-rate effect, the other is survivor sorting.
Every month a store operates adds to the pool of people who could come back, so returning revenue builds on a structurally growing base while new-customer revenue resets each period against fresh acquisition. An aging store's returning share rises for that arithmetic reason alone. If you also run seasonal acquisition, the split will swing with your new-customer calendar rather than with anything about loyalty.
The subtler force is sorting. A single cohort's retention rate tends to climb with age mainly because the high-churn customers leave first, so the survivors look more loyal even though no individual became more loyal (Fader & Hardie et al., Journal of Interactive Marketing, 2018). The returning side of your revenue mix inherits that illusion. The discipline that corrects it is the same one the retention file lays out: read fixed acquisition cohorts at fixed windows and compare cohort to cohort, rather than watching a blended ratio drift and calling the drift a trend.
Less, usually, but not by the multiple everyone cites and for a plainer reason than loyalty. The “5x cheaper to retain than acquire” line has no traceable primary study; the oldest supporting figure is a 2003 Bain study of banking at about 4x (hashtagpaid's trace-back). The defensible asymmetry is not a magic number, it is a channel. A returning customer is already sitting in your email and SMS lists, so reaching them costs a send, while a new customer costs a paid click.
That cheap owned-channel access is easy to spend badly. In three randomized catalog experiments, the same deep discount raised first-time buyers' future purchasing, by 14% in one and 34% in another, but cut established customers' future revenue by roughly 20%, to $585 per customer against $734 for the control (Anderson & Simester, Marketing Science, 2004). A blanket discount to your base spends margin exactly where the evidence says it does damage, which the retention evidence file covers in detail.
The reactivation itself is worth doing, and its dynamics are measured. Only 12% of inactive subscribers read a win-back email, yet 45% of recipients re-engaged with the brand later, on average 57 days after the send and mostly without ever opening the win-back itself (Return Path win-back study, 300 million messages). And in an eight-year telecom study, customers who had left over service carried a higher second-lifetime value than those who left over price, while customers who had referred others were the most likely to accept a win-back offer (Kumar, Bhagwat & Zhang, Journal of Marketing, 2015). Reactivation is cheaper to reach, not free to earn, and a reflexive discount is the wrong default.
Read two absolute revenue lines rather than one ratio, and fix two measurement traps before you trust the dashboard number. Both traps make the raw split lie in predictable directions.
Shopify's built-in returning-customer rate is order-based, not customer-based, so it can move with order mix rather than with customer behavior (BLOY). And if you sell on a marketplace as well as your own site, reorders placed on Amazon show up as new customers on Shopify, which understates your true returning share (Eightx). Correct for both before you read a trend into the number.
Plot new-customer revenue and returning-customer revenue as separate lines over time. A business that is genuinely healthy grows both, and the ratio between them becomes a description rather than a verdict. A rising returning share sitting on top of a flat or falling new-customer line is the acquisition warning the blended ratio hides. Pair those two lines with fixed-cohort repeat behavior, timed to where your own repurchase comeback curve flattens, and you can separate loyalty from arithmetic.
The claims this file cut or downgraded, and why:
“Returning customers drive about 40% of revenue.” Real but routinely misquoted. It is Adobe's 2011-to-2012 figure for the 8% of site visitors who were returning or repeat purchasers, not a current customer-based revenue share, and in that dataset the majority of revenue came from the first-time side (Adobe Digital Index, 2012). Cite it as a dated visitor-mix statistic, never as the share of revenue your returning customers contribute today.
“It costs 5x (or 5 to 25x) more to acquire than to reactivate or retain.” No traceable primary study; the line propagates from secondary citations that reference nothing, and the oldest supporting figure is a 2003 Bain study of banking at about 4x (hashtagpaid trace-back). Industry, product, and stage swamp any universal multiple.
“Returning customers spend 67% more” and similar per-customer multiples. These trace to vendor blogs without primary methodology, and they confuse selection with causation: heavy buyers are the ones who return, so the gap partly labels who those customers already were rather than an effect of returning.
“A rising returning-customer share proves loyalty is improving.” The share is a ratio that also rises when acquisition stalls, and it drifts upward on its own as a store ages and as churners exit early (Fader & Hardie et al., 2018). A rising share is not, by itself, evidence of improved retention.
“Reactivation is inherently cheaper than acquisition.” The defensible asymmetry is channel, owned email and SMS versus paid clicks, not a fixed multiple. And the cheap channel is easy to misuse: deep discounts to your established base cut their future revenue by roughly 20% in randomized tests (Anderson & Simester, 2004).
“The 60% returning-revenue DTC benchmark.” A practitioner rule of thumb, not a measured cross-store dataset. Category and store maturity move the honest number so far in both directions that a single target describes almost no real store.
ASK THE AI. Paste into ChatGPT or Claude, with numbers you already know:
· “Here is my monthly revenue split into new-customer and returning-customer dollars for the last 12 months: [paste]. Plot each as its own line and tell me whether my rising returning share is loyalty improving or new-customer acquisition slowing, and which absolute line I should worry about.”
· “I sell in [category] and my store is [X] months old. Given that returning share drifts up as a store ages and as high-churn customers exit early, how much of my returning share is likely just maturity, and how should I read it on fixed acquisition cohorts instead of on the blended number?”
· “I want to reactivate lapsed customers without training my base to wait for discounts. Given my average order value of [X] and my reachable email and SMS list, compare the likely cost of an owned-channel win-back against a paid click for a new customer, and suggest a non-discount angle to lead with.”
There is no universal number. A monthly-consumable brand can run most of its revenue through returning customers within a couple of years, while a durable-goods or luxury store stays new-customer heavy by design. Read the trend of your own new and returning revenue as two absolute lines and compare fixed acquisition cohorts, rather than benchmarking a single ratio against another store.
Usually, but not by the “5x” multiple that circulates, which has no primary source. The defensible reason is channel: a lapsed customer is already reachable in your email and SMS lists, so a win-back costs a send while a new customer costs a paid click. Lead with product rather than a discount, because deep discounts to your existing base cut their future revenue in randomized tests (Anderson & Simester, 2004).
Not on its own. The share is a ratio, so it rises when returning revenue grows and equally when new-customer revenue falls, and it drifts upward as a store ages regardless of performance. A rising share alongside flat or falling new-customer revenue is an acquisition warning, not proof of loyalty.
MetricsNavigator builds your new-versus-returning revenue trend, acquisition cohorts, and repeat-purchase curves from your store's real order history when you connect your store. The split read honestly, without the spreadsheet.


